Power Bi Training Institute In Hyderabad
Excel Ur Gyan is one of the best power bi training Institute near you, as we providing training Practical scenario so that a people will learn the subject not just complete the subject.
People will be placed who has the subject.
We provides Power Bi Training in Ameerpet .Excel Ur Gyan offering training with 100% Job assistance. Our Trainers are best in Industry it can help students to understand what exactly the industry looking for?
How to Learn Power Bi technology with practical and help to get placed in Top MNC Companies?
Or
If you are the one who is searching for the Power Bi training institute in Hyderabad/Power Bi training in Ameerpet / SAP Street?
If Yes then you’re in right Place to Enroll to Our Power Bi course Today itself.
Excel Ur Gyan is the Best Power Bi Online Training Institute with Real Time data senior. Excel Ur Gyan Guaranteed the Best Power Bi Training as we team up with the most passionate, professional and dedicated Trainers. Master in Power Bi Course with our well designed and Top Class Interactive Instructor. Power Bi Training at Excel Ur Gyan is completely Real-Time and Practical with Real-time Scenarios.
Click HERE to Register with us for Power bi Training

100% Placement Program
JOB Assurance: Our Placement Officer will send for Interviews till you Get Placed. Interview Q & A provided which are frequently asked in Companies. Real Case Studies/Examples provided to clear Interviews Easily. Practical Knowledge Training on Each Topic.
Training Advantages
Excel Ur Gyan Trainers are highly experienced, skilled and certified trainers in training and production. Excel Ur Gyan team is known for their expertise training Subject which helps you crack interview and helps to real time work also. Lot of real time scenarios will be discussed by Excel Ur Gyan team which will help to get job with in limited time.
Excel Ur Gyan Provides Mock interviews for job seekers .We provides services across various location in the Globe, Excel Ur Gyan focus on every Individual student, Excel Ur Gyan specially designed teaching techniques are adopted by most and are globally accepted. Excel Ur Gyan main Motto on providing quality training with real time situations, which helps you to think and grow in the Software Industry Excel Ur Gyan team will support and provide solutions after getting job also.
What is Power BI?
Microsoft Power BI Provides End to End Business Intelligence Services. Business Intelligence is a process which helps Business Data into Visual Information format which help to run the business. The Power BI Compnets for Development is “Power BI Desktop” which helps us to Prepare, Model and Visualize the Data. You can use “Power BI Service” a Cloud Based Server or “Power BI Report Server” an On Premise Server for Sharing the Visuals or Insights to Clients/End user. Clients can View the Insights or Visuals in Mobile Phone using a Mobile APP “Power BI Mobile”.
Get SQL Training In Hyderabad
What are the advantages of Power BI?
- Power BI is Drag & Drop Functionality.
- Power BI License Cheaper.
- Power BI Can Analyses with Different Sources.
- Quickly Prepare, Model and Visualize the Data.
- Prepare Interactivate Reports and Dashboards.
- Share Reports and Dashboards Various methods.
- Power BI Insights can be accessed across multiple platforms and devices.
- Power BI Visuals can Supports Visual Interactions i.e Drilldown Features,Tool tip Etc.
- Power BI supports Schedule refresh and Incremental Refresh.
Excel Ur Gyan is the Best Power BI Training Institute In Hyderabad. We also provides Power BI Online Training across the world. Power BI is a self-service, cloud-based, business intelligence (BI) tool which helps to prepare the report quickly. Microsoft Power Bi is a leading corporation for Business Intelligence in the Market
Click Here To Get Power BI Online Training
BUSINESS INTELLIGENCE
The Tool helps converting the data into Visual Information for Business Insights called Business Intelligence. Business Intelligence helps take the business decisions for the Management with more accurate.
Insight BI Tool
Power BI is Data Visualization tool which help to get Business insight. BI (Business intelligence)which helps end-users/Clients empowered information needs in a Visual Manner, with Insight BI, non-technical professionals can generate their own reports, run their own queries, and conduct their own analysis, without the assistance of IT staff.
CLOUD-BASED Services
Power BI is a Cloud-Based Business Intelligence tool. Cloud-based Services is a applications resources made available to users on-demand in the Internet from Cloud servers. With the help of Power BI, you can Analyze your data anywhere or any point of the world through internet by logging into Servers.
Get Power BI Training In Hyderabad At Excel ur Gyan, We provides You Complete Below Modules with real time serious.
POWER BI TOOLS
Power BI main Compands are
Power BI Desktop
- Power Query
- Power Pivot
- Power View
Power BI Report Server
Power BI Service
Power BI Mobile
POWER BI DESKTOP
Power BI Desktop is a tool which provides Data, model and visualize from various Sources and convert the data as per the requirement, model the data (Data Modeling/Relationship) and visualize the data attractive and interactive report and dashboards.
Power-BI-Online-Training
POWER QUERY
Power Query is a ETL Tool. Power Query is used for extract, transformation and load the data in to information it will connect to the different Data Sources and Transform the data and then we will load the datasets into Power Pivot. Data Sources Transformed (ETL) in Power BI we called as Power Query.
The Power Query gives you unlimited potential to transform your data in just about any way possible such as reverse pivot table, un-pivot table, Append and Merge table, Conditional column Custom Column with M language to create custom functions. Power Query not only makes all these tasks easier, but it also records your steps in Advance Editor in M Language.
POWER PIVOT
Power Pivot is one main Future of Power BI. Power Pivot is used for Data Modeling/relationship. Power Pivot is the place where we place the transformed data that is loaded after power query to data modeling. Power Pivot works on (xVelocity In-Memory) based tabular Module. Power Pivot and the modeling engine star schema, calculated measures, and columns, build relationships through entities and With DAX(Data Analytics Expression) for Calcualted measures and calculated columns. DAX is a powerful functional language that contains multiple functions that are helpful to create measures and calculated columns and calculated table .
Power bi Desktop user interface for building the Report and with the help of Tool-Tip,Drill-through,Bookmarks and parameters etc help for create attractive report
POWER VIEW
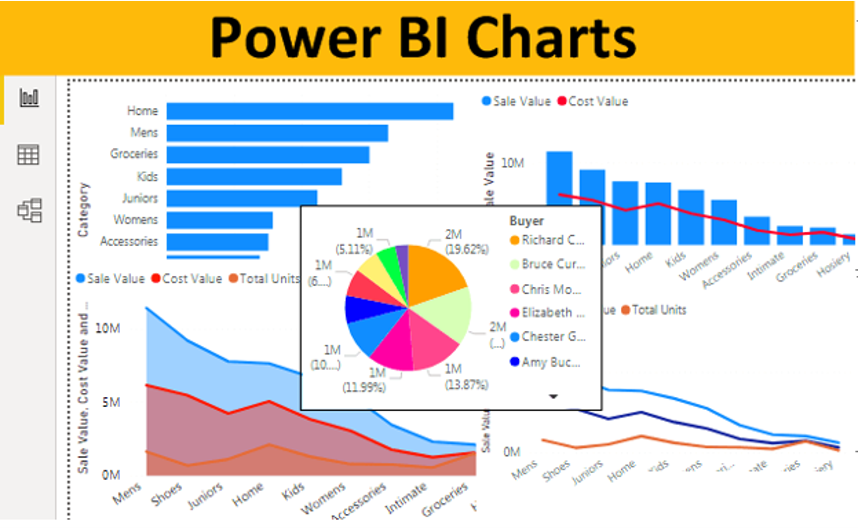
Power View is also one of future in Power BI. Power View is used for data Visualization with the help of charts, graphs, maps, and other custom visuals that bring your data to interactive visual representation form.
POWER BI DESKTOP
Power BI Desktop Major components are Power Query, Power Pivot, and Power View. Power Query use for mash up the data with M language, the result set of Power Query will be loaded into a tabular model /Power Pivot. Power Pivot use to set the relationships(Schemas) and create measures and calculated columns and set the data model as per the requirement. Then Power View connects to the model and visualizes the data with different charts and visualization elements i.e Pie,Donout,Bar,column,Ribbion etc.
POWER BI SERVICE
Power BI Service is a cloud based services provides by Microsoft Corporation for creating, publishing, and managing reports/Dashboard/RLS/Schedule Refresh. With help of Power BI Service you can share report/dashboard to the end-users/Clients.
Reports or Dashboards shared with or without security(RLS)from Power BI Service can be accessed anywhere from the world.
Reports or Dashboard will be refresh automatically with the Gateways for refresh date at Schedule time
POWER BI MOBILE
Reports and dashboards Can View in Mobile with the help of Power Bi Mobile Services. Power BI Mobile App Services is available for Android, Apple, and Windows Phone, download it from Google Play (Android), or App Store (Apple), or Windows Store (Windows Phone) and install.
Power bi Mobile App can login with your server credentials (username and password), and you’ll see Reports and Dashboards shared with you.
Power Bi workflow
A common flow of work in Power BI is
- Fetch data into Power Query or Power BI Desktop, and generate a report.
- Create new visualizations or build dashboards.
Publish into the Power BI service or Power BI Report Server. - Share your dashboards to End Users/Clients.
- Shared dashboards and reports in Power BI Mobile/Tablet/Services
- Schedule refresh the data with the help of Gateways.
Power BI Online Training With Excel Ur Gyan
Excel Ur Gyan Trainings is the provides Best Power BI Online Training Institute. We provide Completely Real-time and Practical Scenario’s in our Course Curriculum with Certified Trainers and industry experts. We are the one of the Best Power BI Online Training as we provides industry oriented examples with professional and dedicated Trainers.
Success relies on giving the 100% inputs to students which helps them get Placemenmt.
Click HERE to register with us for Power BI Online Training.
WHY Excel Ur Gyan for Power BI Online Training and Classroom Training Class ‘A’ Infrastructure
Experienced and Certified Trainers
Official Curriculum
Latest Course materials with monthly update
Small Batch Size for more personal attention(one on one session also)
Completely Real-time and Practical Sessions
Mock Exams
Real-Time Project Explanation
Resume Preparation
Interview Questions Discussions
Mock Interviews
Career Counseling
100% Job Assistance for Placemen
Power BI Course Content
Topics To Be Covered
Power BI (Power Query)- Data Preparation
- ETL – Introduction
- Getting Data – Various Sources
- Datatypes – Numeric, Text, Datetime, Boolean and Binary
- Comparison Operators
- Logical Operators – Logical OR, Logical AND, and Logical NOT
- Power Query Introduction
Transformation Activities
- Data Converting
- Data Filtering – Numeric, Text, Date &Time and Reduce Rows
- Data Deriving – General, From Text, From Number and From Date & Time
- Data Sorting – Reading Latest file
- Data Combining – based on Number, Text, Date
- Data Appending
- Combine Files
- Data Aggregation – with/without Data Combining
- Data Pivoting
- Data Unpivoting – Creating Dynamic axis report
Different Types of Connectivity
- Import
- Direct Query
- Differences Between Import & Direct Query
- Connect Live
M-Script
- Introduction to M; Power Query Formula Language
- Learning M-Syntax
- Predefined Functions
- Creating Custom Functions
- Calling M-function with Invoke Custom Function
- Advantages of M-Script
Tuning & Others
- Performance Tuning
- Getting Data with Different Connectors
- Common Activities
- Use Cases
Introduction to Power BI – Visualization Basics
- Creating Visualization in Power BI
- Fields Configuration for Visuals
- Fields Formatting in the Modeling
- Formatting Visuals
- Analytical Lines for Visuals
- Page Formatting and Configurations
- Creating Visuals with Q&A
Data Exploration
- Drill Down and Drill Up
- Filter Pane to Filter data
- Filter Pane Configuration
- Drill through Filter
- Slicers Options for End Users
- Syncing Slicers Across Multiple Pages
- Displaying Selected Values from Slicers
Advanced Visualization in Power BI
- Report Page Tooltip
- Edit Interactions between Visuals
- Designing Report for Phone Views
- Grouping Data based on Text Fields
- Grouping Data based on DAX calculation
- Binning Data based on Datetime or Numeric Fields
- Bookmarks
- Selection Pane
- Controlling Visuals with Bookmarks & Selection Pane
Column and Bar Charts – Category Analytics
- Stacked Bar Chart
- Stacked Column Chart
- Clustered Bar Chart
- Clustered Column Chart
- 100% Stacked Column Chart
- 1000% Stacked Bar Chart
Line & Area Charts – Trend Analytics
- Line Chart
- Area Chart
- Stacked Area Char
Combo Charts – Different Scales in Visual
- Line & Stacked Column Chart
- Line & Clustered Column Chart
Group Charts
- Pie Chart
- Donut Chart
- Treemap Chart
Cards
- Single Card
- Multi-Row Card
KPI Visuals
- Gauge Chart
- KPI Chart
Grid Visuals
- Table
- Matrix
- Conditional Formatting Grid Visuals and Charts
Map Visuals
- Map Visual with Bing Map
- Map Visual with Latitude and Longitude
- Filled Map
- Shape Map
- ArcGIS Map
Other Charts
- Ribbon Chart – Ranking
- Waterfall Chart
- Scatter Chart
Custom Charts
- Custom Slicers
- Custom Visuals
- Recent Updates in Power BI
- Creating Realtime Dashboard
Data Modeling
- Introduction to Data Modeling
- Fact Tables
- Dimension Tables
- Star Schema
- Snowflake Schema
- Integrated Schema
- Data Loading into Power Pivot
- Creating Relationships
- What is Relationship
- Direction of the Relationship
- Active or Inactive Relationship
- Formatting Data Fields
- Sorting a Column by Another Column
- Hiding/Unhiding Column(s)
- Hierarchies
- Auto Summarization
- Other Configuration Fields
DAX and Calculations
- our Types of Calculations in Power BI
- Introduction to DAX
- New Column
- New Measure
- New Column vs New Measure
- Quick Measure
- Operators in DAX
- Functions in DAX
Math Functions
- ABS Function
- DIVIDE Operator
- DIVIDE function
- POWER Function
- INT Function
- ROUND Function
- ROUNDUP Function
- ROUNDDOWN Function
- SIGN Function
- SQRT Function
- SUM Function
- SUMX Function
Variables and Parameters
- Variables for Better Performance and Readability
- Adjusting DAX Expression
- Simplifying DAX Expressions
- Creating Variables in DAX
- Purpose of RETURN in DAX
- Writing a Function inside Function
- Breaking Logic into Pieces with DAX
- What-if Parameter
- Parameter Table or Disconnected Table
Text Functions
- BLANK Function
- CONCATENATE Function
- CONCATENATEX Function
- EXACT Function
- FIND Function
- FORMAT Function
- LEFT Function
- LEN Function
- LOWER Function
- MID Function
- REPLACE Function
- REPT Function
- RIGHT Function
- SEARCH Function
- SUBSTITUTE Function
- TRIM Function
- UNICHAR Function
- UPPER Function
- VALUE Function
Date & Time Functions
- CALENDAR/CALENDARAUTO Functions
- DATE Function
- DATEVALUE Function
- DAY Function
- EOMONTH Function
- HOUR Function
- MINUTE Function
- MONTH Function
- NOW Function
- SECOND Function
- TIME Function
- TODAY Function
- WEEKDAY Function
- WEEKNUM Function
- YEAR Function
Aggregate Functions
- AVERAGE Function
- AVERAGEA Function
- AVERAGEX Function
- COUNT Function
- COUNTA Function
- COUNTAX Function
- COUNTBLANK Function
- COUNTROWS Function
- COUNTX Function
- MAX Function
- MAXA Function
- MAXX Function
- MIN Function
- MINA Function
- MINX Function
Information Functions
- ISBLANKFunction
- ISERRORFunction
- ISEVENFunction
- ISNUMBERFunction
- ISODDFunction
- ISTEXTFunction
- USERNAME/USERPRINCIPALNAME
Filter Functions
- ALLFunction
- CALCULATEFunction
- FILTERFunction
- RELATEDFunction
- RELATED TABLEFunction
- CALCULATEFunction
- DISTINCTFunction
Related/Relationship Functions
- RELATED function
- RELATEDTABLE function
- Using CrossFilter to change the Direction of Relationship
- UserRelationship to use an inactive Relationship
Logical Functions
- AND/OR Function
- FALSE/TRUE Function
- IFFunction
- IFERRORFunction
- NOT Function
- SWITCH
Time Intelligence
- Introduction to Time Intelligence
- Default vs Custom Date Table
- Calendar/CalenderAuto Functions
- Year to Date Calculation
- Financial Year to Date
- Quarter to Date
- Month to Date
- Comparting This Year vs Last Year, Growth & Variance
- Calculating Last Month’s value
- DateAdd function
- Rolling 12 Months Calculation
- Calculating the Average in the Rolling 12 Months Period
Microsoft Power BI Service – Part 1
- Introduction
- Creating Account in Power BI Service
- My Workspace
- Dashboards
- Reports
- Datasets
- Workbooks
- Creating Report in Power BI Service
- Creating Report with Existed Report
- Creating Dashboard
- Creating and Managing Alerts
- Sharing Report
- Sharing Dashboard
- App Workspaces
- Data Gateway
- Adding Data Sources to Data Gateways
- Data Refreshes – On-Demand and Scheduling
Microsoft Power BI Service – Part 2
- Creating Quick Insights
- Content Pack
- Publishing Report from Power BI Desktop
- Publishing Report from Excel
- Row Level Security
- Power BI Reporting Server
- Introduction
- Installing Power BI Report Server
- Configuring Power BI Report Server
- Installing Power BI Desktop for Report Server
- Deploying Power BI Report to Power BI Report Server
- Scheduling Power BI Reports – On-Demand and Scheduling
Power BI – Others
- Getting Data from Excel
- Getting Data from MS Access
- Getting Data from Text Files
- Getting Data from Power BI Datasets
- Getting Data from Azure
- Getting Data from Web
- Getting Data from Analysis Service Models
- Creating Real time Reports